Using JMX monitoring for BusinessWorks Container Edition
The JMX standard offers the option to monitor Java based platforms and applications. BusinessWorks Container Edition (BWCE) can be monitored using JMX. This document contains an overview of the steps required to enable JMX monitoring. Within this document the tool visualvm is used to show the monitoring information.
Requirements:
- A VM with Docker installed. I used the CentOS VMWare image from OSBoxes.
- The availability of the BWCE base image. A trial version of BWCE can be obtained here.
Step 1) As part of this document the gadgetman application is used. Use the following steps to create an image for this application:
Binary:gadgetman_1.0.0.ear
Sourcecode: gadgetman0.zip
The following steps are used to carry out the test:
Step 1.1) Login to the docker server and create a directory named ‘gadgetman’.
Step 1.2) Put the file gadgetman_1.0.0.ear in this directory.
Step 1.3) Create a file named Dockerfile with the following content:
FROM tibco/bwce:2.4.0
MAINTAINER tibco
ADD gadgetman_1.0.0.ear /
Step 1.4) Run the command ‘docker build -t gadgetman1img .’ from this directory to create an image based on BWCE for the application.
Step 2) Install openJDK 1.8
In order to run visualvm, install JDK 1.8 with the following command: ‘sudo yum install java-1.8.0-openjdk-devel’.
Step 3) Download and install visualvm
Step 3.1) Download visualvm from here. I used version 1.4.2.
Step 3.2) Unzip the download in ~/visualvm_142
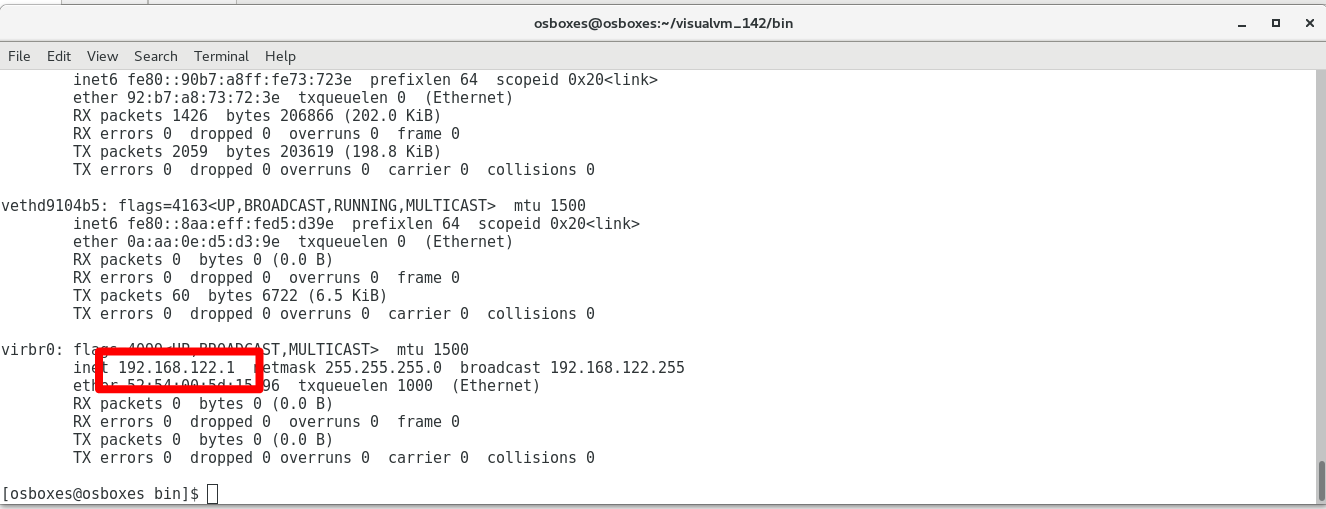
Step 4) Determine the IP address of the docker host
Step 4.1) Run the command ‘ifconfig’ and find out the IP address of the docker host. In this case that is the virbr0 port and therefore the ip address is 192.168.122.1
Step 4.2)
Step 5) Startup container for the BWCE application
In order to startup a container with JMX monitoring the container must be started with two additional parameters:
-e BW_JMX_CONFIG=”<RMI_Host>:<JMX_Port>” <== Remote JMX clients use the RMI protocol to fetch JMX metrics. In order to run the RMI server, it must bind to a IP address and listen to a port. This is set with this parameter. In our example we will bind to 192.168.122.1:8999. This works because visualvm will also run locally. If nevertheless remote monitoring is used, make sure the ip address of the docker host is used.
-p <Host_JMXPortToExpose>:<Container_JMXPort> <== This switch is used to exposed the JMX port on the container. In this case we will use -p 8999:8999
Use the following template:
docker run -name <containername> -e BW_JMX_CONFIG=”<RMI_Host>:<JMX_Port>” -d -p <Host_ApplicationPortToExpose>:<Container_ApplicationPort> -p <Host_JMXPortToExpose>:<Container_JMXPort> <ApplicatonImageName>
Remark:
-name <containername> <== used to give the container a name.
-p <Host_ApplicationPortToExpose>:<Container_ApplicationPort> <== used to expose the user port on the container. Our example applications uses 8181 for rest calls.
Step 5.1) Run the following command: docker run –name “gadgetman1″ -e BW_JMX_CONFIG=”192.168.122.1:8999” -d -p 8181:8181 -p 8999:8999 gadgetman1img
Step 5.2) Run the command ‘docker logs gadgetman1’ to monitor the progress of the startup process. Wait until you see ‘Started BW Application [gadgetman:1.0]’. Please mind: you will have to run the command multiple times to monitor progress.
Step 6) Startup visualvm
Step 6.1) Open an terminal and goto the directory ~/visualvm_142/bin
Step 6.2) Run the command ‘./visualvm’.
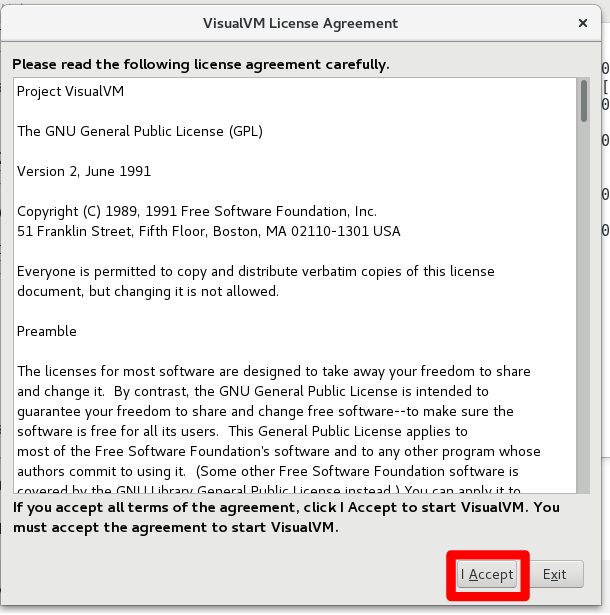
Step 6.3) Accept the license agreement.
Step 7) Configure visualvm
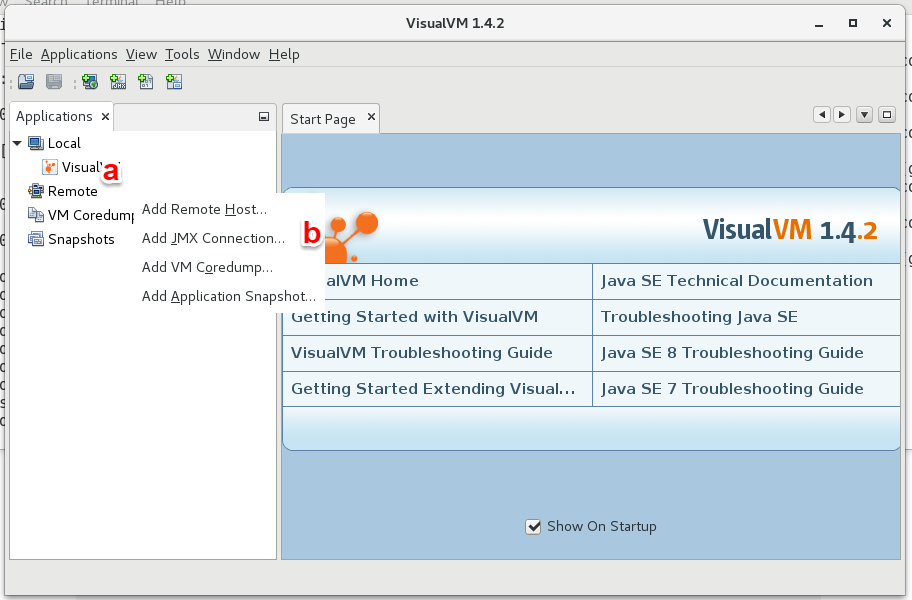
Step 7.1) Create a connection to a remote host
a) Right click on ‘Remote’
b) Select ‘Add Remote Host’
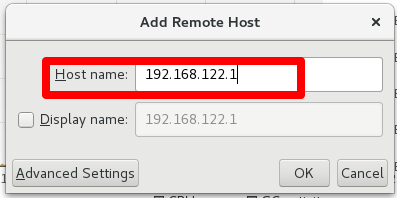
Step 7.2) Enter the IP address of the docker host:
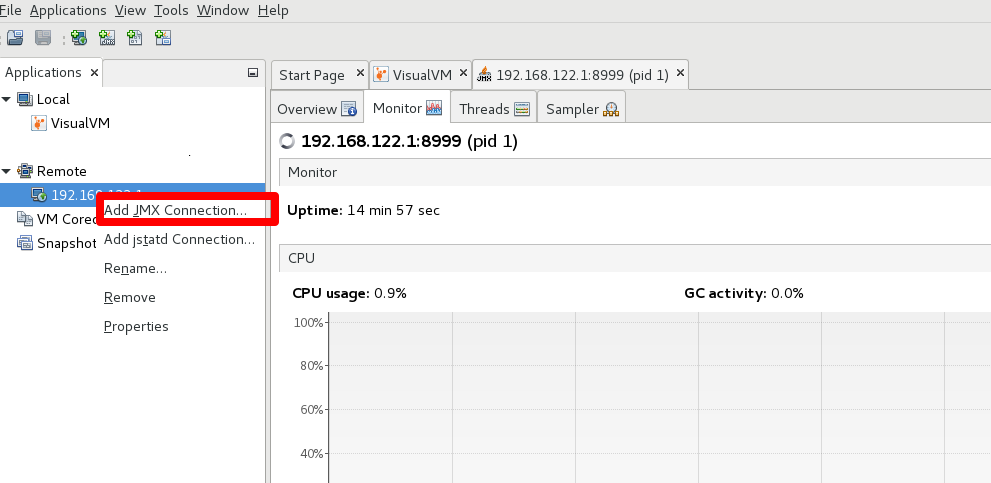
Step 7.3) Right click on the Remote host 192.168.122.1 and select ‘Add JMX Connection’.
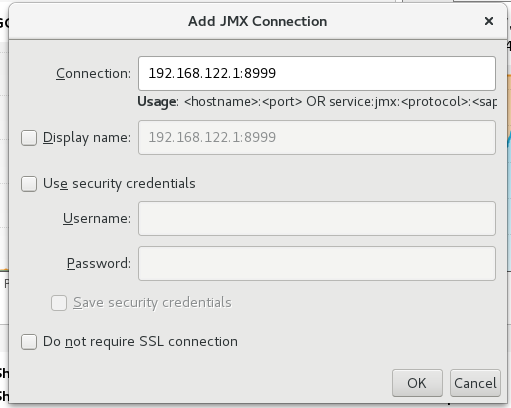
Step 7.4) Configure the JMX port:
Step 8 ) Examine the JMX collected monitoring information.
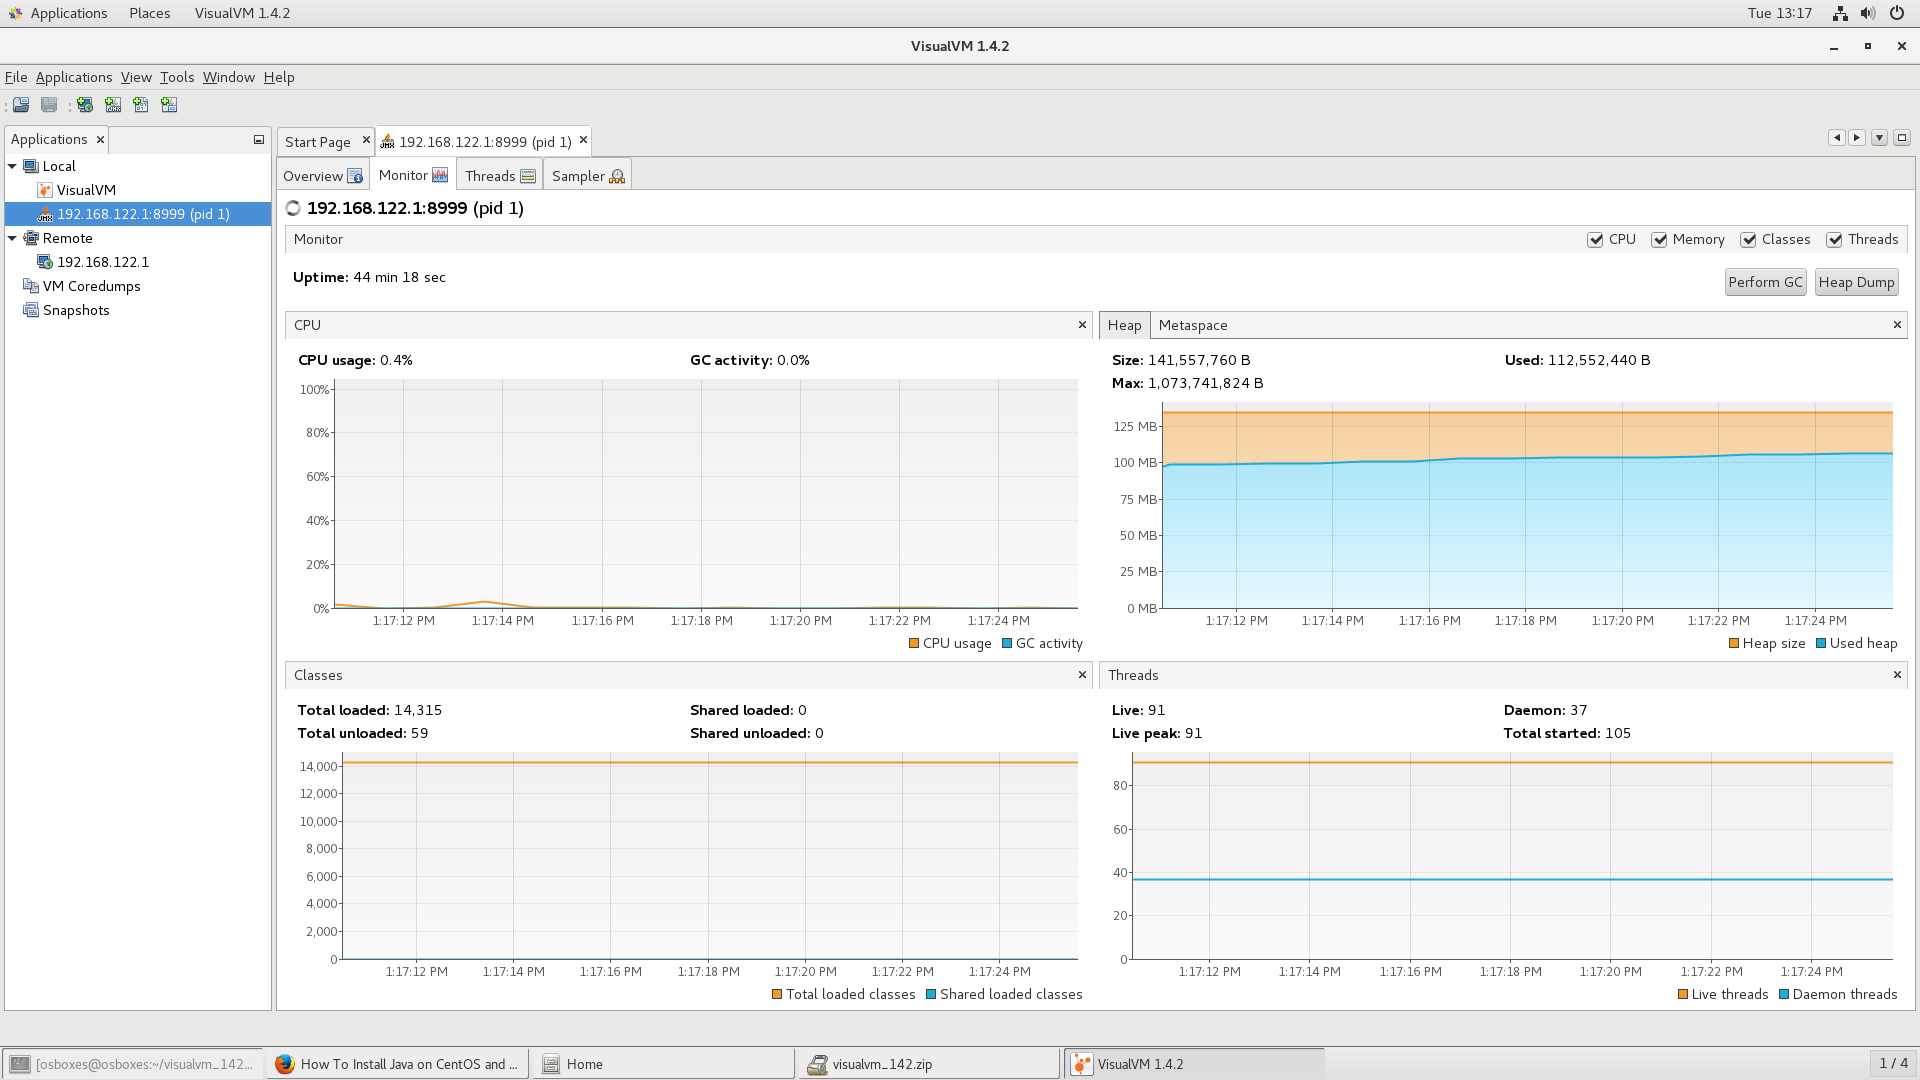
Step 8.1) Open the monitoring informtion by double clicking ‘192.168.122.1:8999
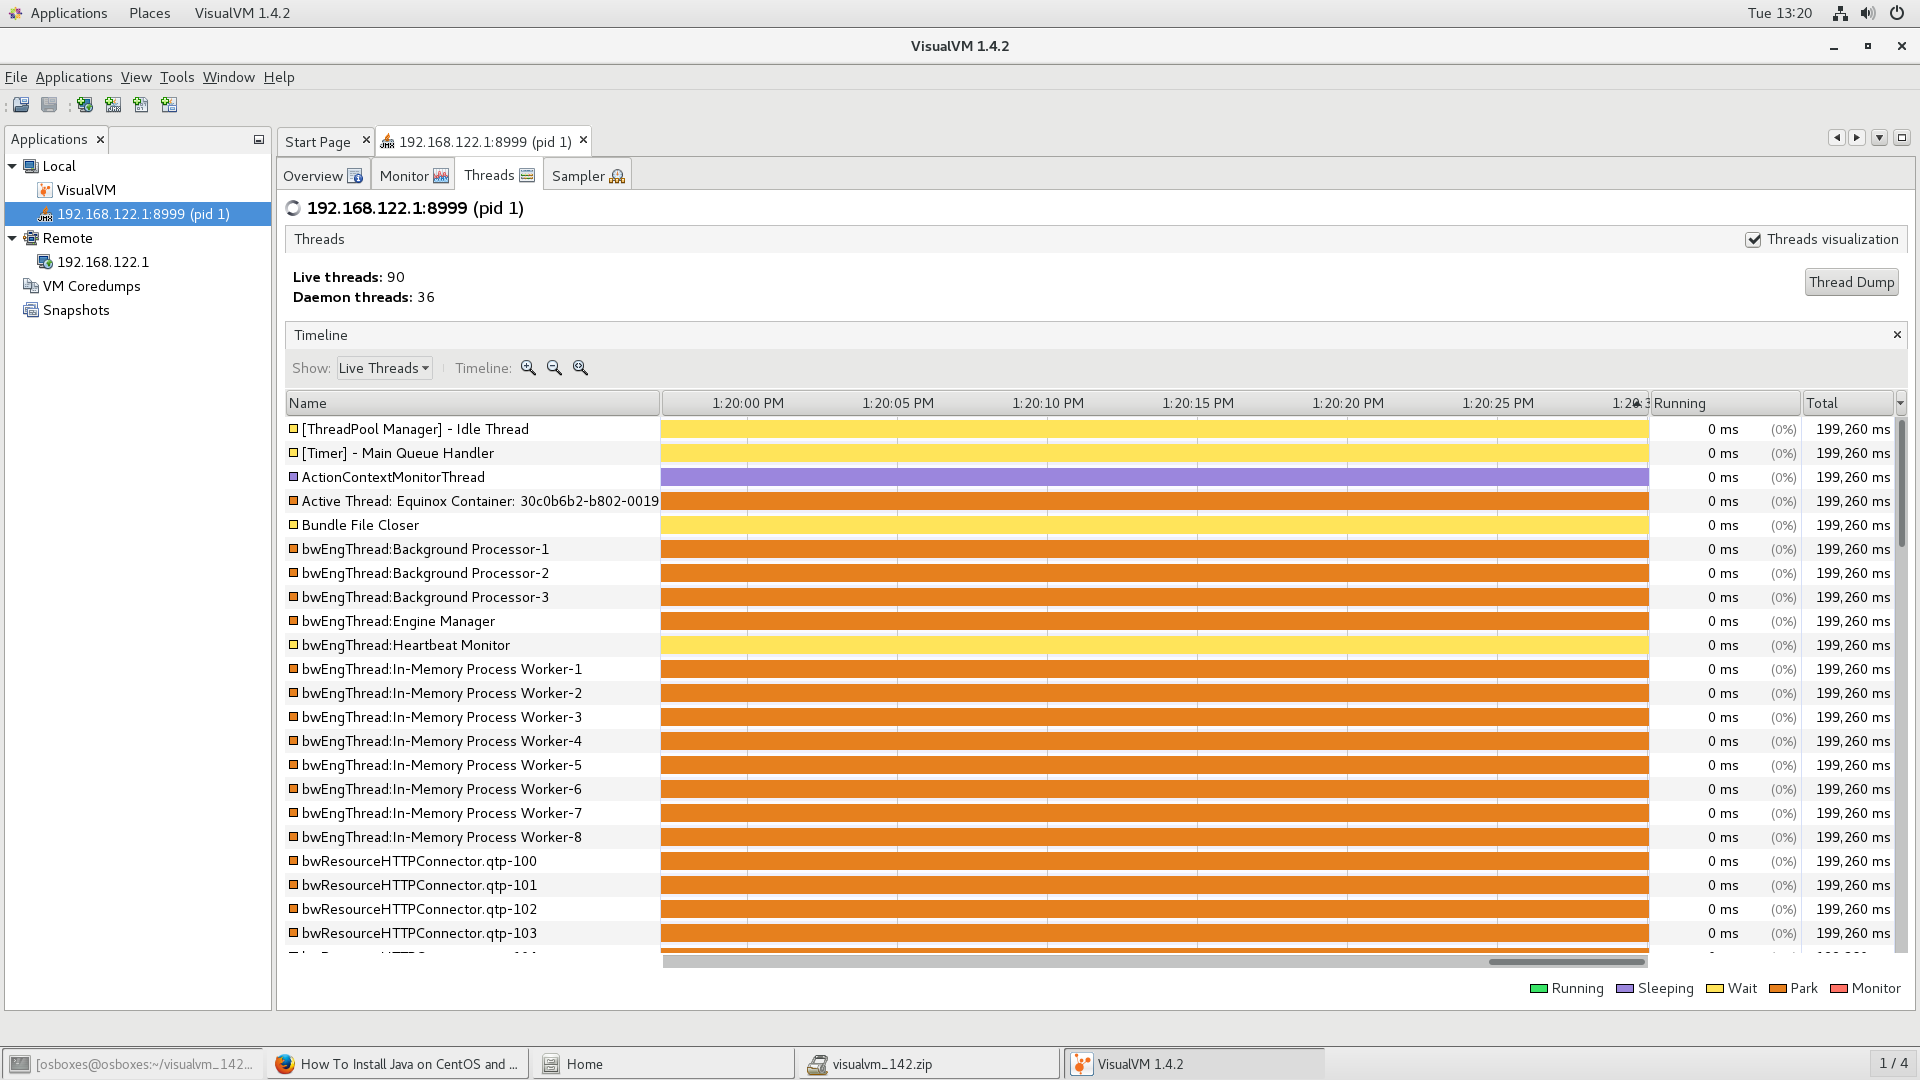
Step 8.2) Open the ‘Threads’ tab and see that the active BW threads are shown.
Step 8.3) Invoke the gadgetman application to create monitoring information
a) Open a browser and open URL http://localhost:8181/swagger/
b) Invoke the rest operation a few times (as quickly as possible)
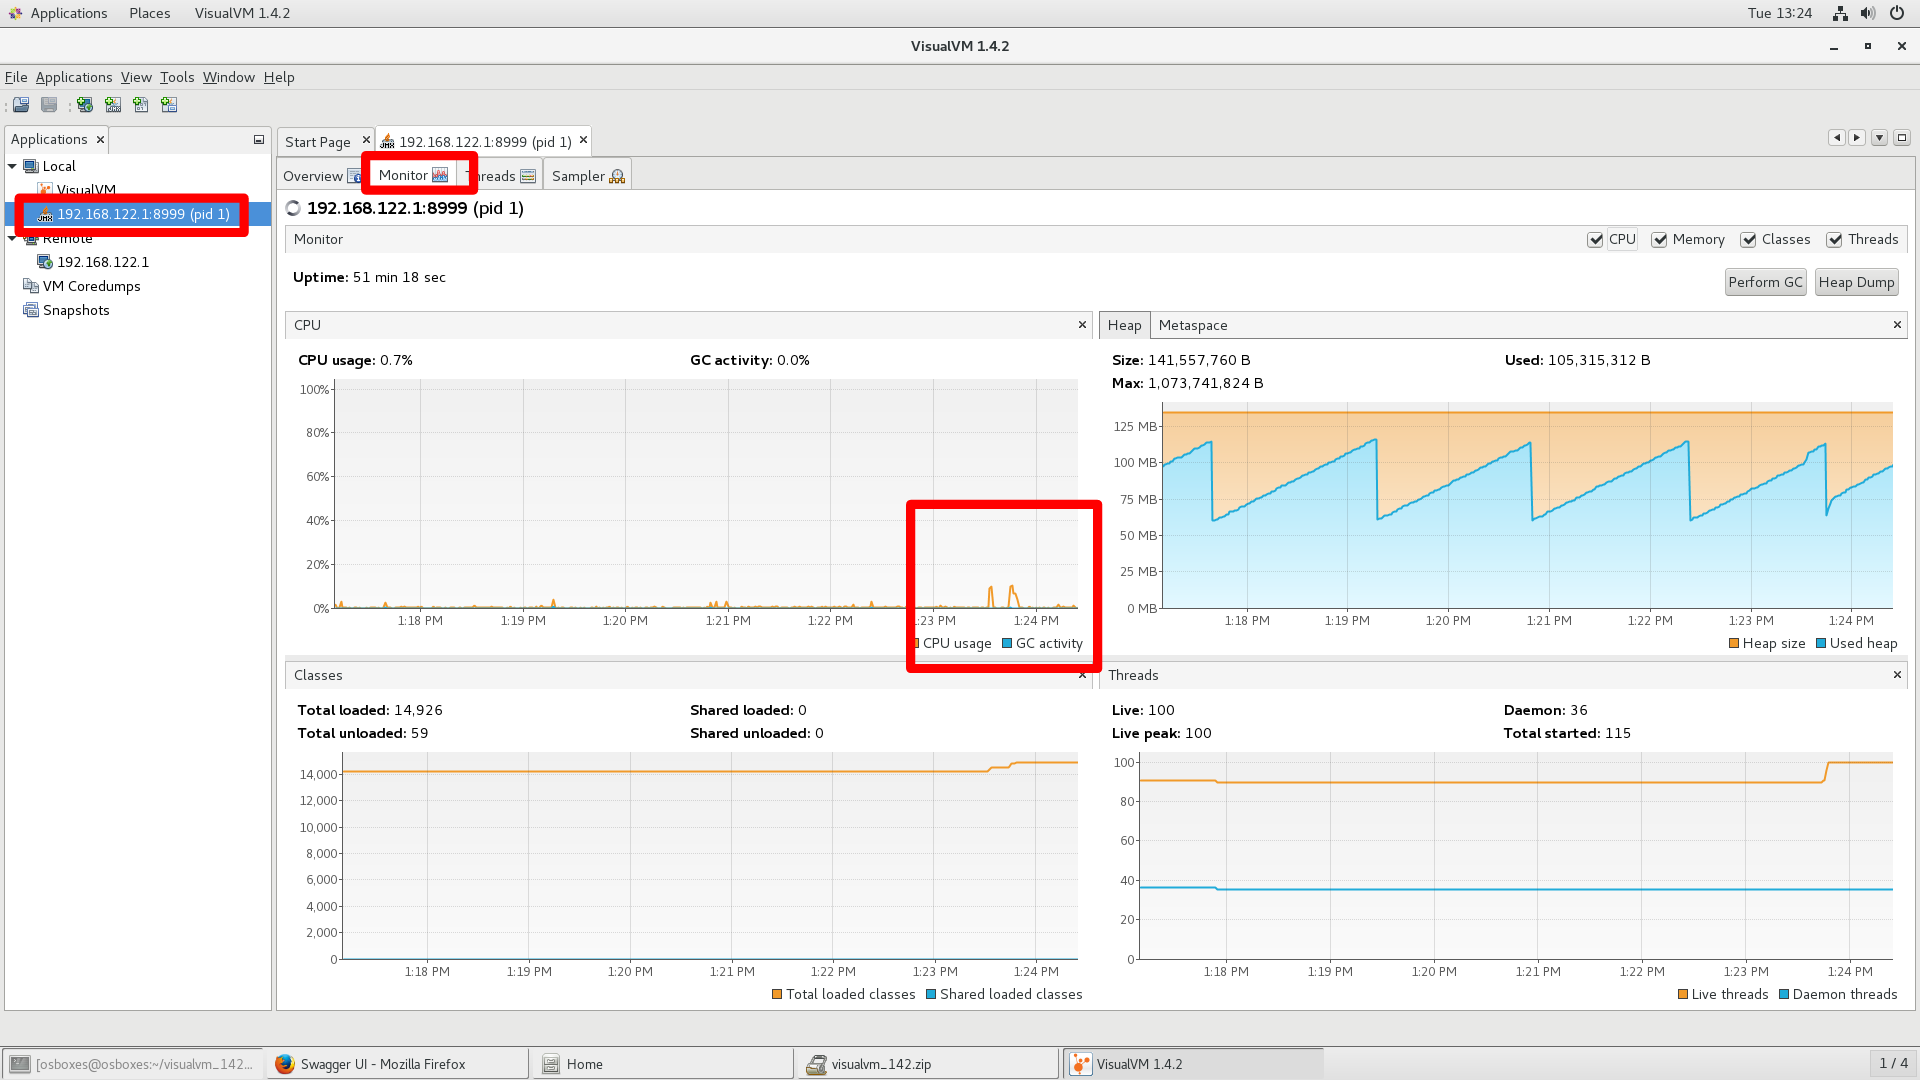
c) Goto visualvm and open the tab Monitor. Notice the fact that some (….) CPU was consumed as a result of the invocations:
Background information:
Enabling JMX in BWCE: https://docs.tibco.com/pub/bwce/2.4.2/doc/html/GUID-BAC813F8-5DDC-4043-86D6-2F5D6C286B02.html
Howto: http://tutorialspedia.com/tibco-bw-performance-monitoring-using-jconsole/
For BW6: